
Details of the user interface of the ZeroLock Management Console's main Dashboard
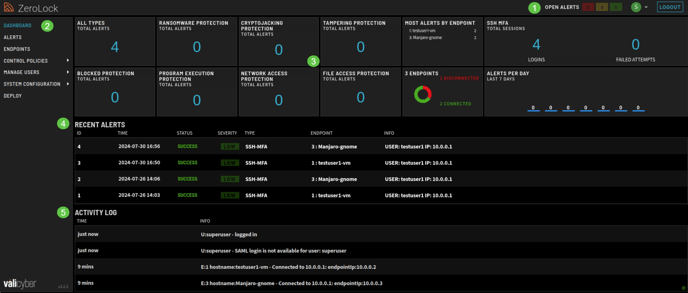
The home screen of the ZeroLock Management Console (ZMC) is called the Dashboard. Providing a wealth of information at a glance, the display is split into five (5) areas: Banner, List of Homepages, Status, Recent Alerts, and Activity Log.
BANNER 
The ZeroLock banner is the starting point for managing the ZeroLock Management Console (ZMC). From this point on the upper right of the ZMC, you can access the current alerts status, edit the contact information for the logged-in user, change the password for the user, and set up Multifactor Authentication (MFA) for the user.
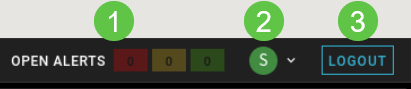
1) Open Alerts
Selecting OPEN ALERTS takes you to the ALERTS section. The three (3) tabs to the right represent the counters for the severity types of alerts – High, Medium, and Low. Selecting any of these will also take you to the ALERTS section.2) User Profile
To the right of the counters is the Profile button. The initial on the button represents the logged-in user who, in this case, is the Default Tenant ‘superuser’. Selecting that button, a drop-down screen appears with the User name and Manage Account. The user name is static, but Manage Account is interactive.
Note: The option Set Tenant will appear under Manage Account for user accounts configured for multiple Tenants.
3) Logout
This will log you out of the ZeroLock Management Console.
For more information on the ZMC Banner please use the link - ZMC Banner.
List of Homepages

STATUS
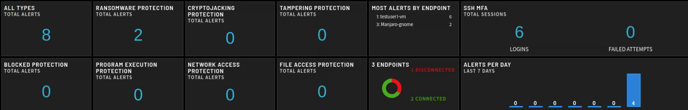
The Status section consists of twelve (12) tiles that provide a snapshot of the current state of each monitored section of ZeroLock protected systems (Endpoints).
The tiles are divided as follows:
One (1) tile for the total number of alerts to date.
Four (4) tiles dedicated to specific malicious activity ZeroLock is protecting the endpoints from.
- Ransomware
- Cryptojacking
- Tampering
- Blocked
Three (3) tiles representing the protection alerts generated for:
- Program Execution
- Network Access
- File Access
Four (4) tiles depicting the following information:
- The total number of alerts generated by each endpoint.
- A visual of the connections status of the endpoints.
- SSH MFA logins for both successful and failed attempts.
- The number of alerts generated each day over the last 7 days.
ALERTS
An alert is generated when ZeroLock detects system behavior that meets criteria set forth by previously configured Control Policies and Rules.
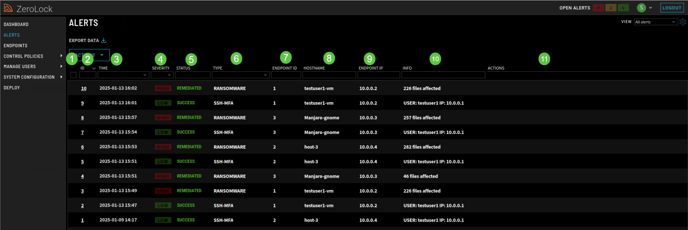
The Alerts screen provides information for up to 100 alerts. The most recent alerts are visible, with the ability to scroll down to see any previous alerts.
Column Headings:
- Checkbox - if all alerts are to be selected, check the box in the heading. If only specific alerts are to be viewed, select those boxes.
- ID – This is the number of the alert. ID numbers increase sequentially from the 1st alert generated when the Endpoint is started.
- TIME - The time an alert occurred. The timing of the alert narrows down how or by whom the malware was introduced into your system. Formatting is dd-mm-yy hh:mm:ss:ms.
- SEVERITY – The Severity level is defined in the Configuration Profile for a particular endpoint. The levels are Low, Medium, and High. The default Endpoint profile settings are:
a. Low for SSH MFA connections.
b. Medium severity for attempts at Tampering (Canary Files, File Access, Network Access, malware), Cryptojacking, and HASH rules.
c. High severity alerts are generated by ransomware. Assigning alert severity levels is ultimately up to the user. - STATUS - Detected, Killed, Remediated, Success, Suspended.
a. Detected – ZeroLock detects system behavior that meets criteria set forth by previously configured Control Policies and Rules.
b. Killed - All associated processes are stopped.
c. Remediated - The threat processes have been stopped, corruption removed, and all impacted files restored.
d. Success - of SSH-MFA login attempts.
e. Suspended – The process that triggered the alert is stopped but no further action is taken. If so configured, the Administrator is also notified. - TYPE – Refers to the type of detection that generated the alert.
a. Blocked – Ruleset to block actions that meet a specific criterion.
b. Cryptojacking - Ruleset for what criteria and actions are taken when cryptojacking is detected on the Endpoint system.
c. File Access – Ruleset on processes is attempting to perform prohibited actions on a system files.
d. Network Access – Ruleset on what processes can/cannot access the network.
e. Program Execution – Ruleset on what processes or commands can or cannot execute specific programs on an Endpoint.
f. Ransomware – Ruleset for what criteria and actions are taken when malware is detected on the Endpoint.
g. SSH MFA – Ruleset providing granular control of remote access.
h. Tampering – Ruleset for what action is taken when processes are detected that meet the criterion of the rules. - ENDPOINT ID – This is the identifier of the Endpoint where the threat was detected.
Quantity Name ENDPOINT value shown 1 testuser-1-vm 1: testuser-1-vm 2 host-3 2: host-3 - HOSTNAME – The name of the host on which the Endpoint resides.
- ENDPOINT IP – This is the IP address of the Endpoint where the threat was detected.
- INFO - If malware, the number of files infected. If SSH-MFA, User ID, and IP address. If a Lockdown rule, the name of the rule violated.
Malware: 45 files affected
SSH-MFA: User: testuser1 IP:10.0.0.1
Lockdown Rule: MITRE T1041 Block wget - ACTIONS – This refers to what actions may be taken regarding that alert. When the alert appears, depending on the Response Type settings in the endpoint’s Configuration Profile, there will be one or two (2) buttons visible in this column.
If the Response Type setting is Do Nothing you will see two (2) buttons: Kill and Release.
Both will be discussed in greater detail below.
Alert Details
Clicking anywhere on a row takes you to the ALERTS page for that specific alert incident where much more detailed information may be found. For example, clicking on the ID 41 row brings you to the screen below.
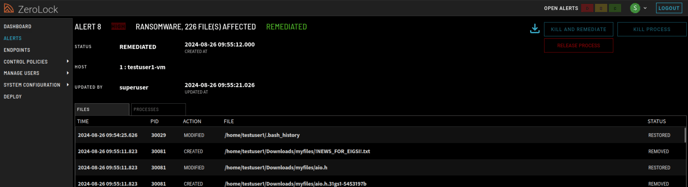
For additional information please use this link - Alerts Homepage.
ACTIVITY LOG
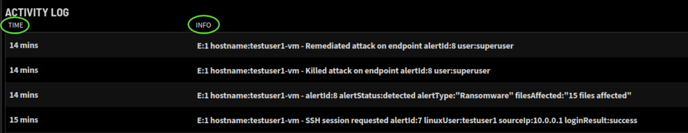
The Activity Log tracks every User’s activity. The TIME column contains the Date and Time of the activity. The format is dd-mm-yy hh:mm:ss.
The INFO column contains a brief description of the activity performed. Examples of the activity tracked include successful and failed login attempts, connecting to endpoints, SSH sessions, disconnecting from endpoints, resetting passwords, and editing configuration profiles. etc.
For more information, please see the Vali Cyber support page.